Sieve analysis test is a commonly used particle size analysis method for granular materials, which is used to determine the particle distribution of different particle sizes in the material. The sieve analysis test program includes steps such as sample preparation, screening device preparation, screening operation and data processing. The sieve analysis test procedure and calculation method will be introduced in detail below.
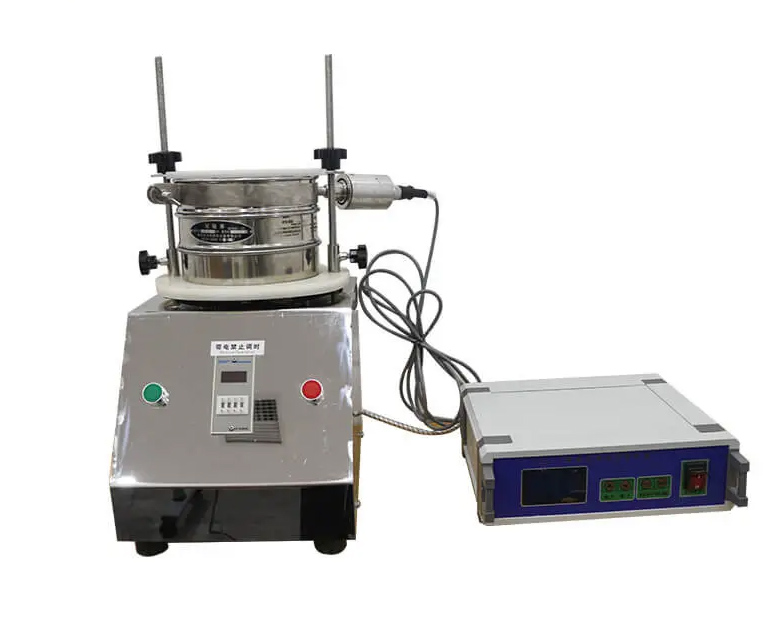
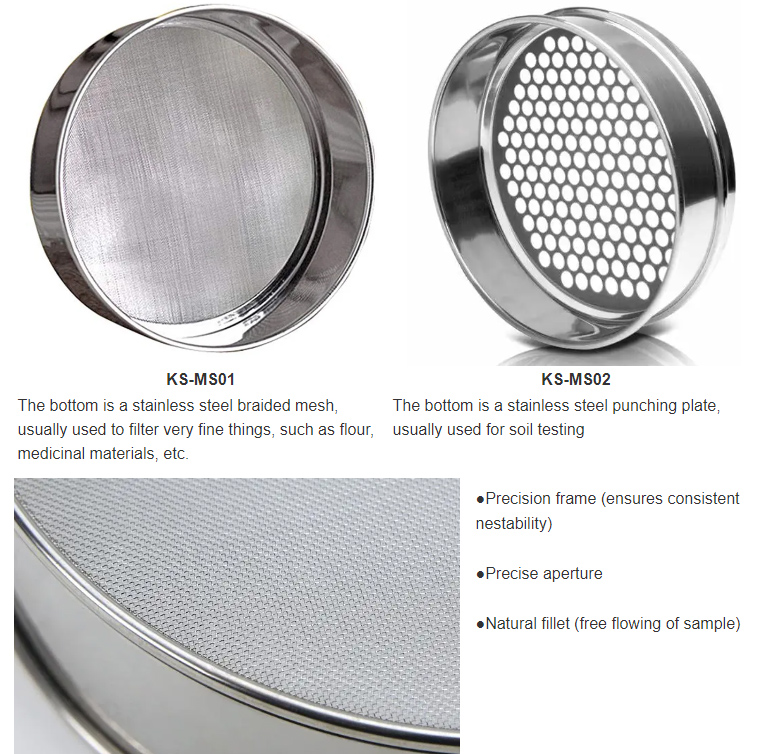
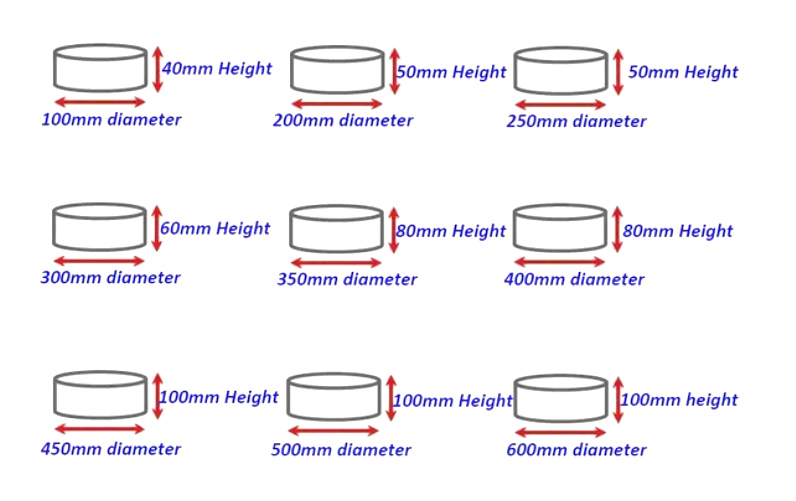
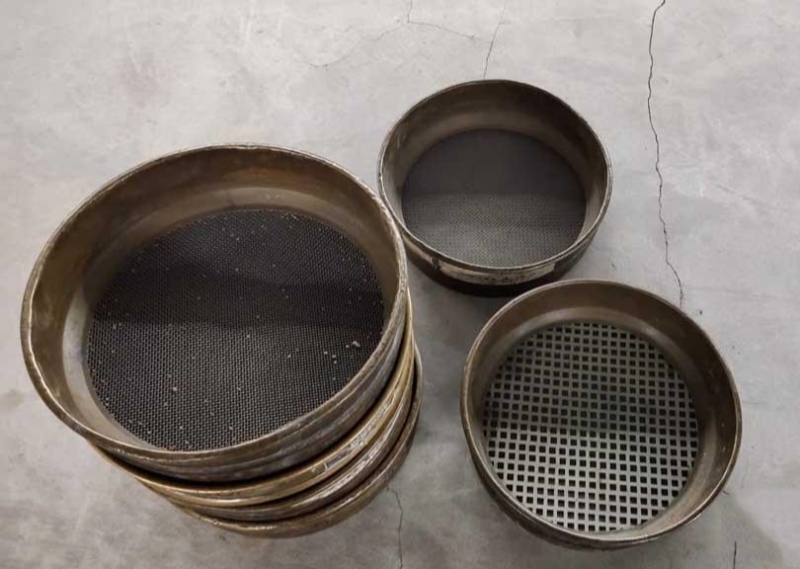
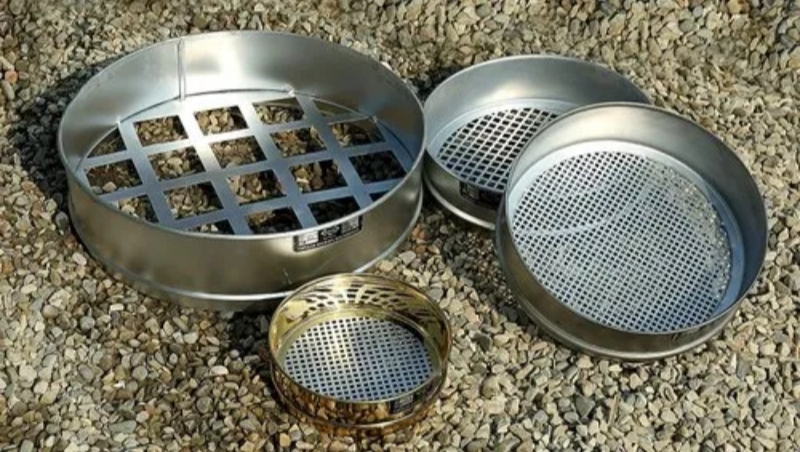
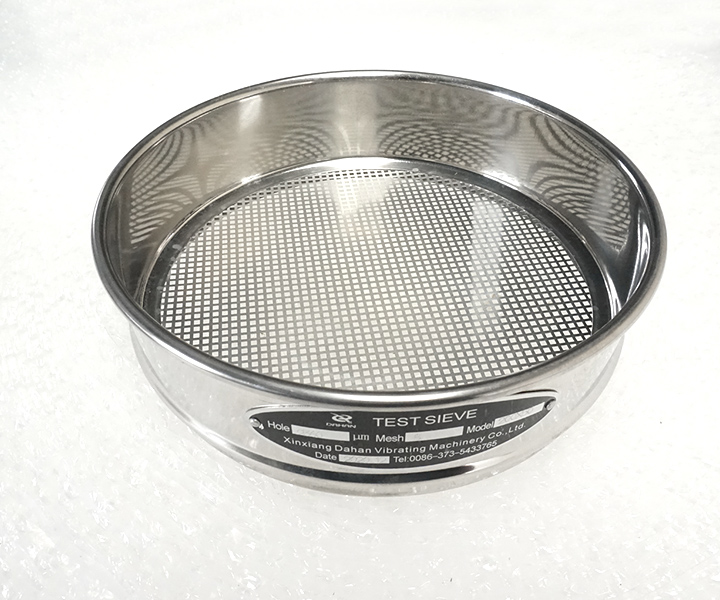
Have the required screens and screening devices ready. Screens are usually made of metal or synthetic materials and come in various pore sizes. Select the appropriate screen combination to cover the desired particle size range. Install the screen on the screening device and ensure the stability of the device.
First, a representative sample needs to be selected as needed and prepared into the appropriate particle size. For powdery materials, physical or mechanical methods are usually used for crushing and grinding to obtain the desired particle size range.
(1) Place an appropriate amount of sample into the top of the screening device and cover the device.
(2) Start the screening device to perform screening operations at appropriate vibration frequency and amplitude. Vibration will cause the sample particles to pass through the sieve holes or stay on the sieve holes, thereby achieving particle separation.
(3) Depending on the screening time, you can choose to stop the screening operation after a specific time interval to ensure that the particle size distribution is fully reflected.
After the screening operation is completed, the data obtained from the screening needs to be processed and analyzed. Here are some common data processing methods:
(1) Gravimetric analysis method: Collect and weigh the particles on each sieve, and calculate the mass of the particles on each sieve. According to the sieves with different mesh sizes, the mass distribution of particles in different particle size ranges can be obtained.
(2) Cumulative analysis method: Accumulate the particle mass on each screen to obtain the cumulative mass percentage curve. This curve reflects the cumulative percentage of particles in different particle size ranges.
(3) Calculation of fineness modulus: Fineness modulus is an indicator of the uniformity of particle distribution. The uniformity of particles over different particle size ranges can be evaluated through fineness modulus calculations.
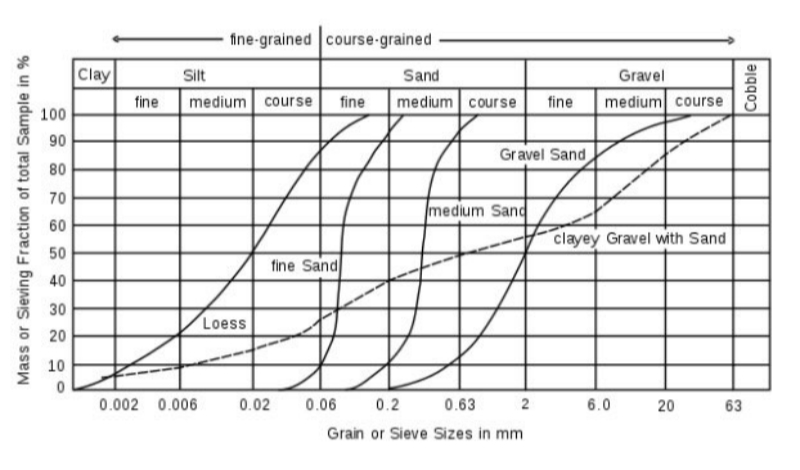
(4) Particle size distribution curve drawing: According to the screening results, the particle size distribution curve can be drawn to intuitively reflect the distribution of particles in different particle size ranges.
Address:China,Yanjin county forest park gate to the west 1000 meters north road.
 Online Chat
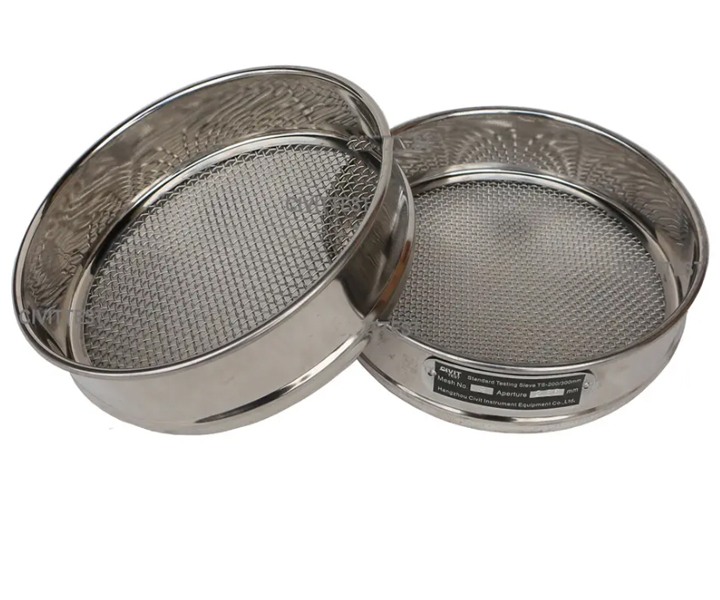
 Email
Email